
The math professors made this way harder than it needs to be. I’ve used Fourier transforms on the plant floor in Detroit for twelve years, and I’ve never once needed to integrate a complex exponential by hand. What you actually need is a working intuition for how it separates noise from signal — and that’s what this guide will give you by the end.
At my last automotive supplier in Michigan, we had a servo drive throwing intermittent faults. The maintenance team replaced the motor twice. The issue? A 58 Hz harmonic from a new VFD three bays over. A ten-second FFT plot showed the spike clear as day. That’s the power of understanding frequency domain thinking. You don’t need a PhD. You need the right mental model and a few practical tools.
This article is for controls engineers, automation techs, and plant managers who keep hearing “Fourier transform” in spec sheets and training videos but aren’t sure how it applies to their actual work. We’ll cover what it is, how it works without burying you in calculus, and four places you’ll use it in a real factory.
Disclosure: Techynovate earns a commission if you purchase through links on this page. This does not affect our independent testing and opinions.
Table of Contents
- What Is a Fourier Transform?
- Why Industrial Engineers Actually Care
- How It Works (Without the Math PhD)
- Real Factory Applications
- Vibration Analysis & Predictive Maintenance
- Sensor Signal Filtering
- Machine Vision & Image Processing
- Power Quality Analysis
- A Simple Example You Can Follow
- Tools & Software That Handle the Math
- What We Didn’t Like
- Verdict & Who Should Learn This
- Key Takeaways
- FAQ
What Is a Fourier Transform?
A Fourier transform is a mathematical tool that breaks a complex signal into its individual frequency components, making it possible to see which frequencies are present and how strong each one is.
Think of it like a prism. White light hits a prism and spreads into individual colors. A Fourier transform takes a mixed signal — say, a jagged voltage waveform from a motor — and spreads it into a bar chart showing how much 60 Hz, how much 120 Hz, how much 180 Hz, and so on. It doesn’t change the signal. It just shows you what’s hiding inside it.
Once you see it, you can’t unsee it.
The concept was developed by Jean-Baptiste Joseph Fourier in the early 1800s. He figured out that any repeating pattern — no matter how complicated — could be rebuilt by stacking simple sine waves of different frequencies, amplitudes, and phases. That’s the core idea. Everything else is just notation.
In industrial settings, we rarely deal with the continuous mathematical form. We use the Fast Fourier Transform (FFT), which is a computational shortcut. An FFT on a modern PLC or edge device can run in milliseconds. You don’t wait for a PC. You don’t wait at all.
Why Industrial Engineers Actually Care
Most sensor data in a factory is messy. Temperature readings wobble because of electrical noise. Vibration sensors pick up every compressor, fan, and forklift in the building. Current transformers catch harmonics from VFDs that have nothing to do with the motor you’re monitoring.
Without frequency domain thinking, you’re stuck staring at wiggly lines and guessing. I’ve seen maintenance teams chase “random” servo faults for weeks because they were looking at a time-domain trend that looked like noise. Switch to an FFT view, and the problem often announces itself as a clean spike at a specific frequency. It’s not magic. It’s just a better lens.
And here’s the kicker: most modern automation platforms already compute this for you. Siemens TIA Portal has built-in signal analysis blocks. Allen-Bradley’s Studio 5000 has add-on instructions for spectral analysis. National Instruments hardware does FFTs in firmware. The math isn’t the bottleneck. Knowing when to apply it is.
How It Works (Without the Math PhD)
I’m going to keep this visual. If you want the full derivation with integrals and Euler’s formula, there are a thousand academic papers for that. What follows is the version I wish someone had handed me during my first month on the plant floor.
Imagine you’re listening to a recording of three people humming different notes at the same time. Your ear hears a muddy chord. But your brain is actually pretty good at picking out the individual pitches. The Fourier transform does the same thing, mathematically. It listens to the mixed signal and produces a list: “Note A at this loudness, Note B at this loudness, Note C at this loudness.”
In engineering terms, the input is a time-domain signal — voltage over time, or acceleration over time. The output is a frequency-domain spectrum — magnitude at each frequency. The horizontal axis switches from seconds to hertz. The vertical axis stays magnitude, but now it’s magnitude per frequency bin instead of magnitude at a moment in time.
The FFT algorithm needs a few things to work cleanly. First, you need enough samples. A common rule of thumb is a power of two: 1,024 samples, 2,048 samples, or 4,096 samples. Second, the sampling rate has to be at least double the highest frequency you care about — the Nyquist limit. Sample a 60 Hz signal at 100 Hz, and you’ll get garbage. Sample it at 1,000 Hz, and you’ll see the fundamental plus several harmonics.
Windowing matters too. Real factory signals aren’t perfectly periodic. If you chop a waveform at an awkward point, the FFT sees a sharp edge and invents high-frequency content that isn’t really there. A Hanning or Hamming window smooths the edges of your sample block and cleans up the spectrum. Most industrial software applies this automatically, but you should know it’s happening.
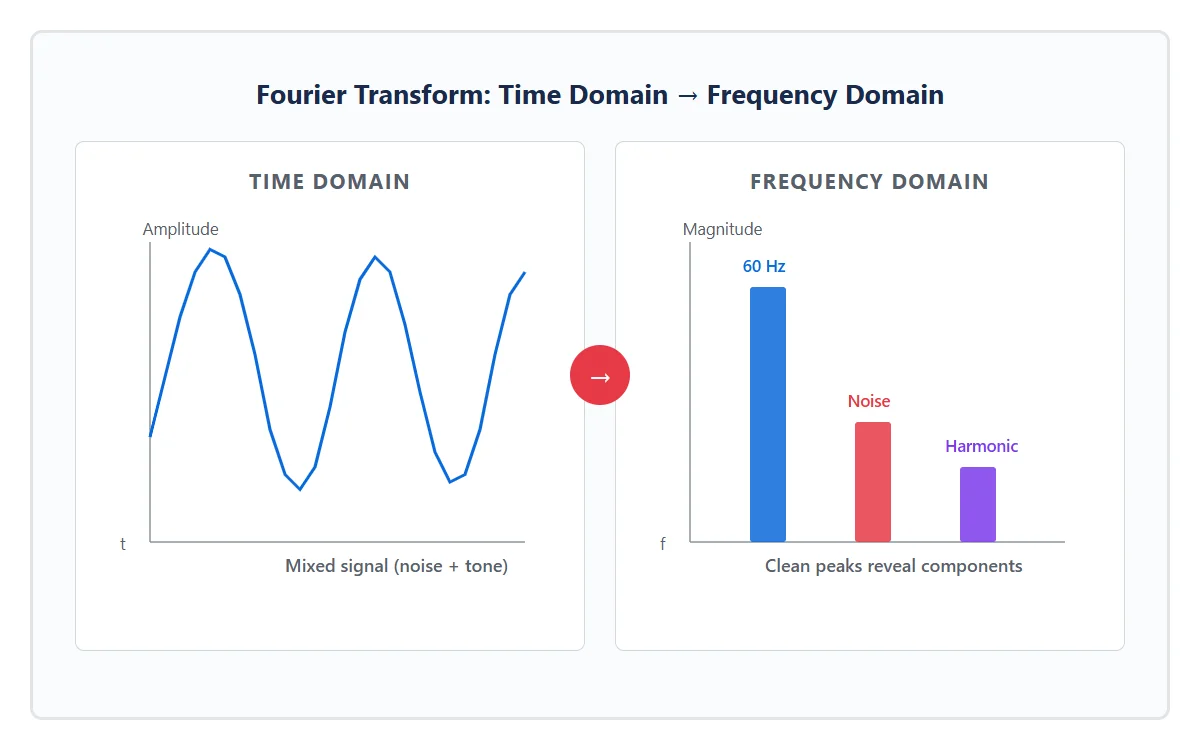
The Fourier transform converts a mixed time-domain signal (left) into discrete frequency peaks (right), making it easy to spot noise, harmonics, and fault signatures.
Real Factory Applications
Theory is fine. But where does this actually show up in your daily work? Here are four places I’ve personally used FFT-based analysis on the plant floor.
Vibration Analysis & Predictive Maintenance
This is the big one. Every rotating machine has a signature. A healthy motor running at 1,800 RPM produces a fundamental frequency at 30 Hz, plus small harmonics at 60 Hz, 90 Hz, and so on. When a bearing starts to degrade, new frequency peaks appear at specific bearing fault frequencies — calculated from the geometry of the races and balls.
We mounted accelerometers on our CNC spindle motors and fed the data into a National Instruments cRIO chassis running LabVIEW Real-Time. The FFT ran every five minutes. Over the course of eight weeks, we watched a 78 Hz peak grow from barely visible to 40% above baseline. That’s exactly the BPFI (Ball Pass Frequency, Inner race) for the bearing model installed. We scheduled replacement during the next planned shutdown. No unplanned downtime. No scrapped parts.
Without the FFT, that trend would have looked like “slightly noisier than last month.” With it, we had a diagnosis.
Sensor Signal Filtering
Analog sensors are noisy. Thermocouples catch 60 Hz coupling from nearby power cables. Pressure transducers pick up pump pulsation. Proximity probes on rotating shafts can read vibration from adjacent equipment.
You can filter in the time domain with moving averages or exponential smoothing. But if the noise sits at a specific frequency — like 60 Hz electrical hum — a frequency-domain filter is surgical. You run an FFT, zero out the bins around 60 Hz, and run an inverse FFT to get a clean signal back. We did this on a critical pressure loop in our paint booth. The 60 Hz noise was causing the PID controller to hunt. A simple notch filter in the frequency domain fixed it in software, no rewiring required.
If you’re running a PLC-based control loop with noisy analog inputs, understanding this technique can save you from adding shielded cable runs that your budget doesn’t have room for.
Machine Vision & Image Processing
Machine vision isn’t all edge detection and blob analysis. Sometimes you need to look at texture frequency. A surface with regular scratches produces a strong frequency peak in the Fourier domain oriented along the scratch direction. A random matte finish doesn’t.
We used this on an inspection station checking machined aluminum housings. The Cognex camera caught every dimensional feature fine, but it struggled to distinguish acceptable tool-mark patterns from chatter marks. By applying a 2D FFT to the image and checking for abnormal frequency concentrations in the mid-range, we caught chatter before it became a dimensional problem. It wasn’t the first approach we tried — but it was the one that worked.
If you’re working with machine vision systems for quality control, frequency-domain texture analysis is a tool worth keeping in your back pocket.
Power Quality Analysis
Modern factories are full of non-linear loads. VFDs, servo drives, switching power supplies, and LED drivers all draw current in short pulses instead of smooth sine waves. Those pulses create harmonic currents that flow back into your distribution system, heating transformers, tripping breakers, and corrupting data on nearby communication cables.
A power quality analyzer uses FFT-derived harmonic analysis to show you exactly which orders are present. We found a 7th harmonic on one of our 480V buses running at 8% of fundamental — well above the IEEE 519 recommendation for industrial plants. Tracing it back led us to a cheap LED driver installed during a weekend retrofit. Swapping it for a PFC-corrected model dropped the 7th harmonic to under 2%.
Power quality isn’t glamorous. But a single afternoon with a handheld analyzer and FFT readouts can prevent six months of mysterious electrical gremlins.
A Simple Example You Can Follow
Let’s walk through a concrete scenario you could replicate tomorrow with free software. No $5,000 spectrum analyzer required.
You have a 4–20 mA vibration sensor on a motor. You’ve logged 4,096 samples at 2,000 Hz using your PLC’s analog input module. You export the data as a CSV. Here’s what you do next.
Step 1: Open the data in Python (or MATLAB, or Excel with the Analysis ToolPak). Run an FFT on the sample array. In Python with NumPy, it’s literally one line: yf = np.fft.fft(signal). The output is an array of complex numbers. Take the absolute value to get magnitude.
Step 2: Build a frequency axis. The spacing between bins is your sample rate divided by the number of samples. With 2,000 Hz and 4,096 samples, each bin is about 0.49 Hz wide. The first half of the output represents frequencies from 0 Hz up to the Nyquist frequency (1,000 Hz). Ignore the second half — it’s a mirror image.
Step 3: Look for peaks. If your motor runs at 1,750 RPM, you expect a strong peak at 29.2 Hz. If you see a large unexpected spike at 150 Hz, that’s not the motor. Something else is shaking at that rate — maybe a pump, maybe a bearing fault, maybe a structural resonance.
Step 4: Compare against baseline. We keep “golden” FFT traces from every major asset taken during commissioning. When a motor’s spectrum deviates by more than 20% in any bin above 50 Hz, we flag it for inspection. It’s not fancy. It’s just consistent.
If you want to try this without writing code, National Instruments has a solid introduction to FFT analysis that includes downloadable examples. It’s worth bookmarking.
Tools & Software That Handle the Math
You don’t need to write the FFT algorithm yourself. Here are the tools I’ve actually used on projects, ranked by how quickly you can get a spectrum on screen.
| Tool / Platform | Best For | FFT Capability | Price Range |
|---|---|---|---|
| NI cRIO + LabVIEW | Real-time condition monitoring | Built-in FFT VI, up to 100 kHz+ | $$$ (hardware + license) |
| Siemens TIA Portal | PLC-integrated signal analysis | Signal analysis blocks in PLCopen | $ (included with license) |
| Python (NumPy / SciPy) | Offline analysis, scripting | Full control, unlimited flexibility | Free |
| Fluke 438-II | Field power quality & motor analysis | Handheld, instant harmonic readout | $$ (handheld meter) |
| Allen-Bradley Studio 5000 | Logix-based vibration monitoring | Add-On Instructions for FFT | $ (included with license) |
My honest recommendation? Start with Python and a cheap USB accelerometer if you’re just learning. The barrier to entry is zero, and you’ll build intuition faster than any $10,000 hardware purchase. Once you know what you’re looking for, upgrade to real-time industrial hardware.
What We Didn’t Like
No tool is perfect. Here are the frustrations I’ve run into with FFT-based analysis in real factory environments.
The resolution vs. speed trade-off. To get fine frequency resolution, you need long sample windows. A 0.1 Hz resolution requires ten seconds of data at decent sample rates. In a high-speed packaging line, ten seconds is an eternity. You can’t catch a transient fault that lasts half a second if your FFT window is ten seconds long. You’ll need to balance resolution against response time for every application.
Leakage and smearing. If your signal frequency doesn’t land exactly on an FFT bin center — and it almost never does — the energy leaks into nearby bins. This smears sharp peaks into gentle hills and can hide closely spaced faults. Windowing helps, but it doesn’t eliminate the problem. I’ve misdiagnosed a bearing fault as “general looseness” because two close peaks merged into one broad bump.
The learning curve on real hardware. It’s one thing to run an FFT on a clean sine wave in MATLAB. It’s another to get meaningful results from a sensor mounted on a stamping press with six other machines running nearby. Ground loops, aliasing, and mechanical cross-talk will teach you more about signal conditioning than any textbook. Be patient.
And the documentation from some vendors? It’s outdated. We spent four hours debugging a spectrum that looked completely wrong before realizing the firmware had changed the default windowing function in version 3.2. The manual still referenced version 3.0. That kind of thing happens more than it should.
Verdict & Who Should Learn This
You don’t need to be a signal processing expert. But every controls engineer working with analog sensors, rotating equipment, or power distribution should understand the basics of the Fourier transform and how to read an FFT plot.
If you’re a plant manager, you don’t need to run the math. You need to know that your maintenance team has this capability — and that predictive maintenance programs built on vibration FFT analysis really do catch failures weeks before they happen. The ROI is real. We’ve measured it.
If you’re a systems integrator bidding on a project, mentioning frequency-domain analysis in your proposal signals that you understand more than ladder logic. It separates you from integrators who terminate wires and leave. Clients notice.
Start small. Log one sensor. Run one FFT. Compare it to a baseline. The intuition builds fast once you’ve seen a healthy spectrum and a failing one side by side.
Interested in how we connect sensors to PLCs for real-time analysis? Read our industrial sensor selection guide for wiring standards, signal conditioning, and I/O mapping basics.
Key Takeaways
- A Fourier transform converts a time-domain signal into a frequency spectrum, revealing hidden components like noise, harmonics, and fault signatures.
- The Fast Fourier Transform (FFT) is the practical version used in PLCs, analyzers, and software — it runs in milliseconds on modern hardware.
- Top factory applications include vibration analysis, sensor signal filtering, machine vision texture inspection, and power quality monitoring.
- You don’t need advanced math — Python + NumPy and a USB sensor are enough to start building practical intuition.
- Always compare spectra against a baseline taken during commissioning; deviation above 20% in key frequency bins is a reliable early warning flag.
FAQ
What is a Fourier transform used for in manufacturing?
In manufacturing, a Fourier transform is used to analyze sensor signals — especially vibration, current, and voltage waveforms — by breaking them into frequency components. This helps engineers detect bearing faults, filter electrical noise, analyze power quality, and inspect surface textures in machine vision systems.
Do I need to understand the math to use FFT in industry?
No. Most modern PLCs, power analyzers, and software packages compute the FFT automatically. You need to understand what the frequency spectrum represents and how to interpret peaks — not how to derive the integral. Think of it like driving a car: you don’t need to design the engine.
What is the difference between FFT and Fourier transform?
The Fourier transform is the general mathematical concept for converting a signal from time to frequency domain. The Fast Fourier Transform (FFT) is a specific algorithm that computes the same result much faster — making it practical for real-time industrial applications on PLCs and edge devices.
How do I choose the right sampling rate for an FFT?
Follow the Nyquist rule: sample at least twice as fast as the highest frequency you want to capture. In practice, sample 5–10 times faster. For vibration analysis on a 3,600 RPM motor (60 Hz fundamental), a 2,000 Hz sample rate gives you plenty of headroom to see harmonics up to 1,000 Hz.
Can a PLC run an FFT in real time?
Yes. Modern PLCs with dedicated analog input modules and sufficient scan time can run FFTs in real time. Siemens S7-1500 and Allen-Bradley ControlLogix platforms both support spectral analysis through built-in blocks or add-on instructions. For high-speed analysis, dedicated condition monitoring modules are a better fit than general-purpose CPU scans.
What causes spectral leakage in an FFT?
Spectral leakage happens when your signal frequency falls between FFT bin centers, or when the signal isn’t perfectly periodic within your sample window. The energy “leaks” into neighboring bins. Applying a window function (Hanning, Hamming, or Blackman) tapers the signal edges and reduces leakage significantly.
Which is better for fault detection: time-domain or frequency-domain analysis?
They’re complementary. Time-domain trends show overall amplitude changes and are great for slow-moving drift. Frequency-domain analysis reveals the specific mechanical or electrical sources behind that amplitude. For rotating machinery, frequency-domain is almost always more diagnostic. For temperature loops, time-domain is usually enough.
Disclaimer: This guide provides general signal processing recommendations for educational purposes. Perform a site-specific risk assessment and consult a certified systems integrator before deploying FFT-based diagnostic systems in production safety or critical process control environments.

About the Author
Michael Chen is an industrial automation engineer with 12 years of experience in PLC programming, SCADA integration, and machine vision deployment. He previously led automation upgrades at a Tier 1 automotive supplier in Michigan and holds Siemens TIA Portal Advanced and FANUC HandlingTool certifications. At Techynovate, he tests PLCs, sensors, and vision systems hands-on.